


Policy watch
Is India losing money faster than inbound FDI?
RN Bhaskar
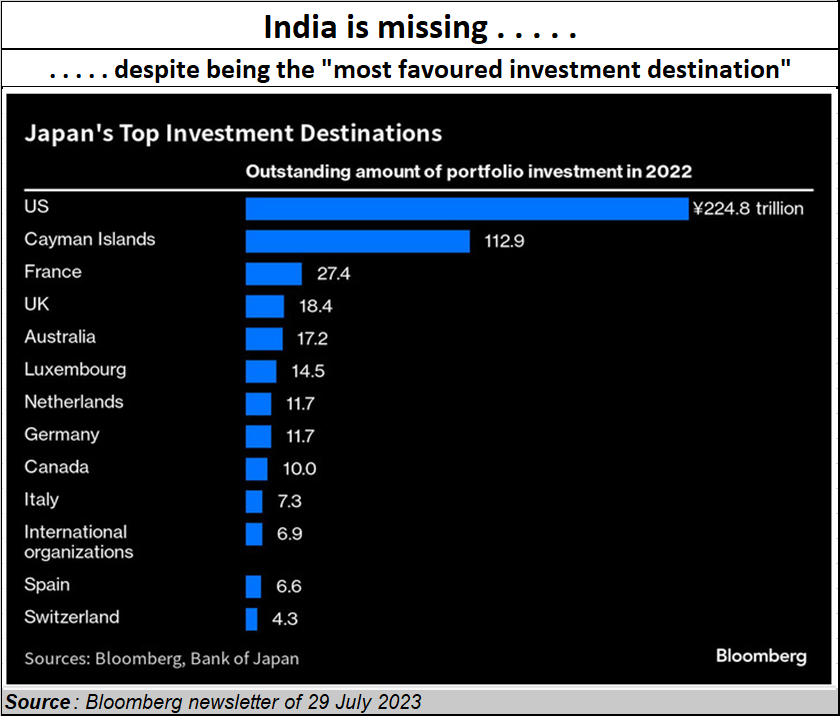
Politicians in India love hyping up this country’s investment story. That means excellent FDI (foreign direct investment) inflows. A good example is the way the Union commerce minister likes to claim that India provides best investment opportunity, destination that can’t be missed (https://www.thehindu.com/news/national/india-provides-best-investment-opportunity-destination-that-cant-be-missed-piyush-goyal/article65856250.ece).
The irony of this statement was clear when Bloomberg published a chart about countries in which Japan had invested. India was not on the list. So, was it really the most attractive destination?
 So, does India have an investment story?
May be, India could become a good investment story. But as this author stated earlier in these columns (https://bhaskarrn.substack.com/p/can-india-become-3-in-the-world-by?sd=pf) without good education and the right business environment (which also means better judicial redressal systems), India is not likely to be a good investment destination.
Consider how, even when spokespersons for the government keep on extolling that India would become the most favoured destination, considering that China had lost its appeal, India accounted for just 3.8% of global inbound FDI.
It is only when one studies the UNCTAD tables in the World Investment Report – 2023 (https://unctad.org/system/files/official-document/wir2023_en.pdf), that one realises how far-fetched these claims can be. It is good to begin with the BRICS countries.
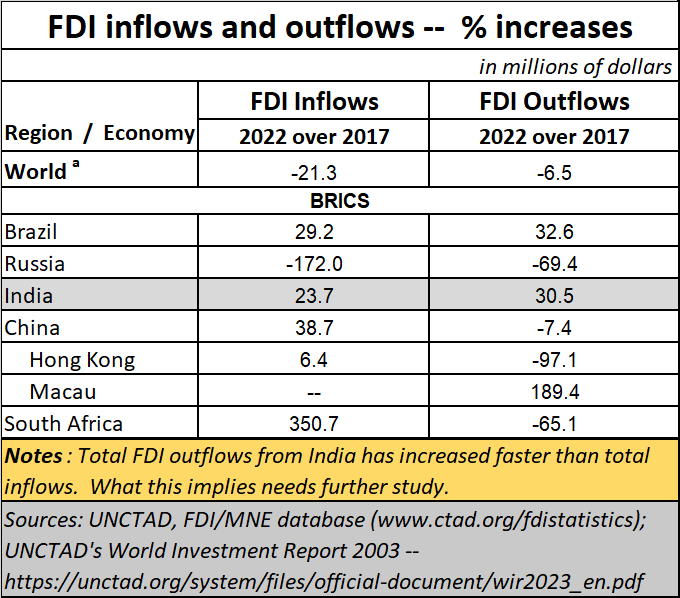
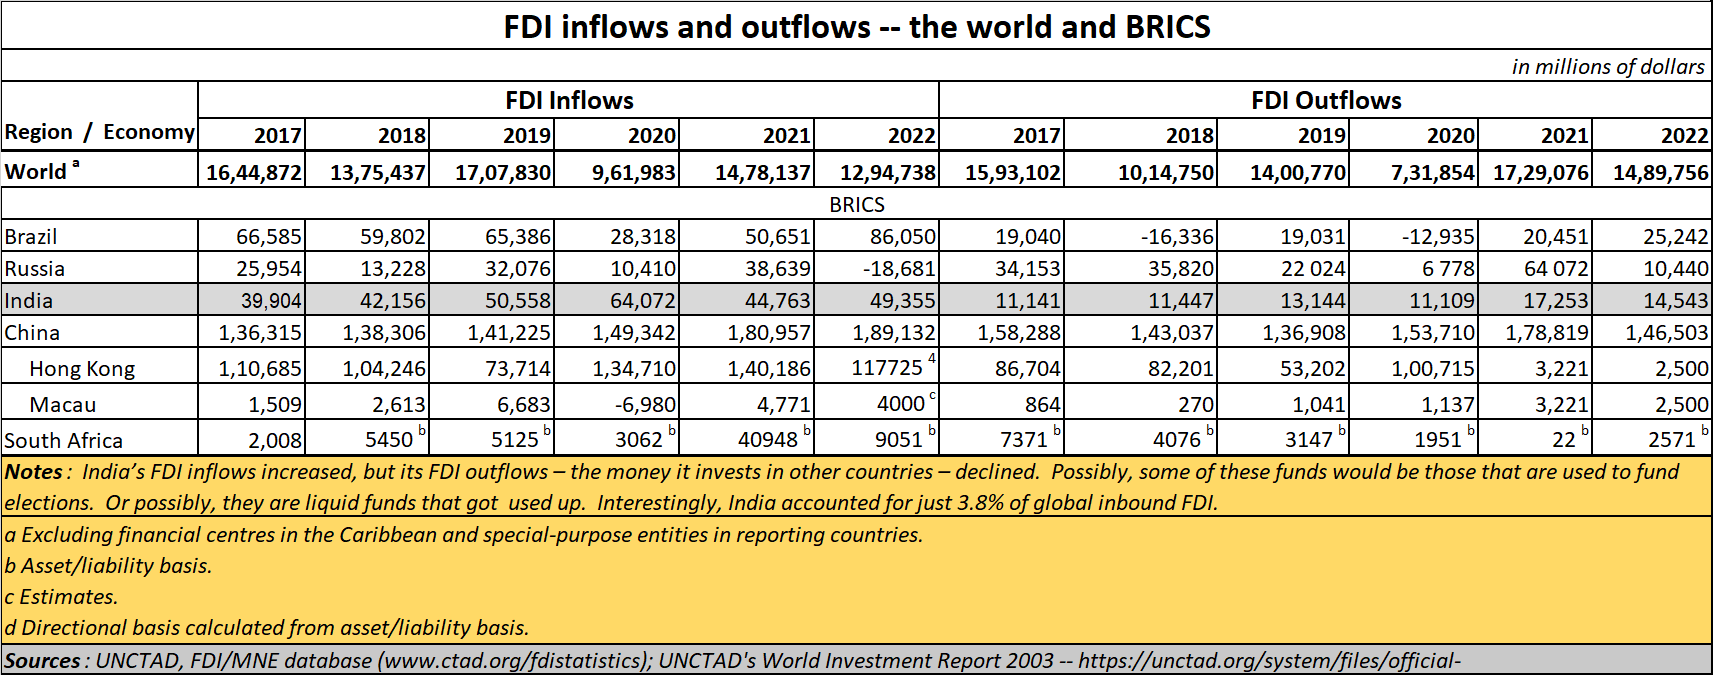 It is then that one realises that while inbound FDI increased, outbound FDI decreased. It is good that inbound FDI increases faster than outbound FDI. But when there is a decline in outbound FDI, a further study is warranted.
Total inbound FDI 2017-22
Such fears gain credence when one looks at total inbound FDI from 2017 to 2022. It is then that you realise that during the 2017-2022 period, India’s inbound FDI grew 23.7% but outbound FDI grew 30.5%. So was money going out more rapidly than money coming in? This would be the case, because the UNCTAD figures deal with investments, not purchases or sales. The latter would get classified as trade transactions. FDI has a totally different connotation. Oubound FDI makes sense when a country has adequate reserves, a positive trade balance and an economy that is vibrant. It becomes worrisome when in spite of all these iondicators being weak, money begins to go out at a faster pace than money coming in.
If this continues unchecked, it could indicate a flight of capital that can be as painful as the numbers for Pakistan show in yet another table given towards the end of this article.
 BRICS
BRICS
If one continues to examine the numbers for BRICS countries, especially the total stock of FDI with them at different points of time, and juxtapose them against global figures, one discovers other interesting facts. This is more so when one looks at FDI stock for the BRICS nations.
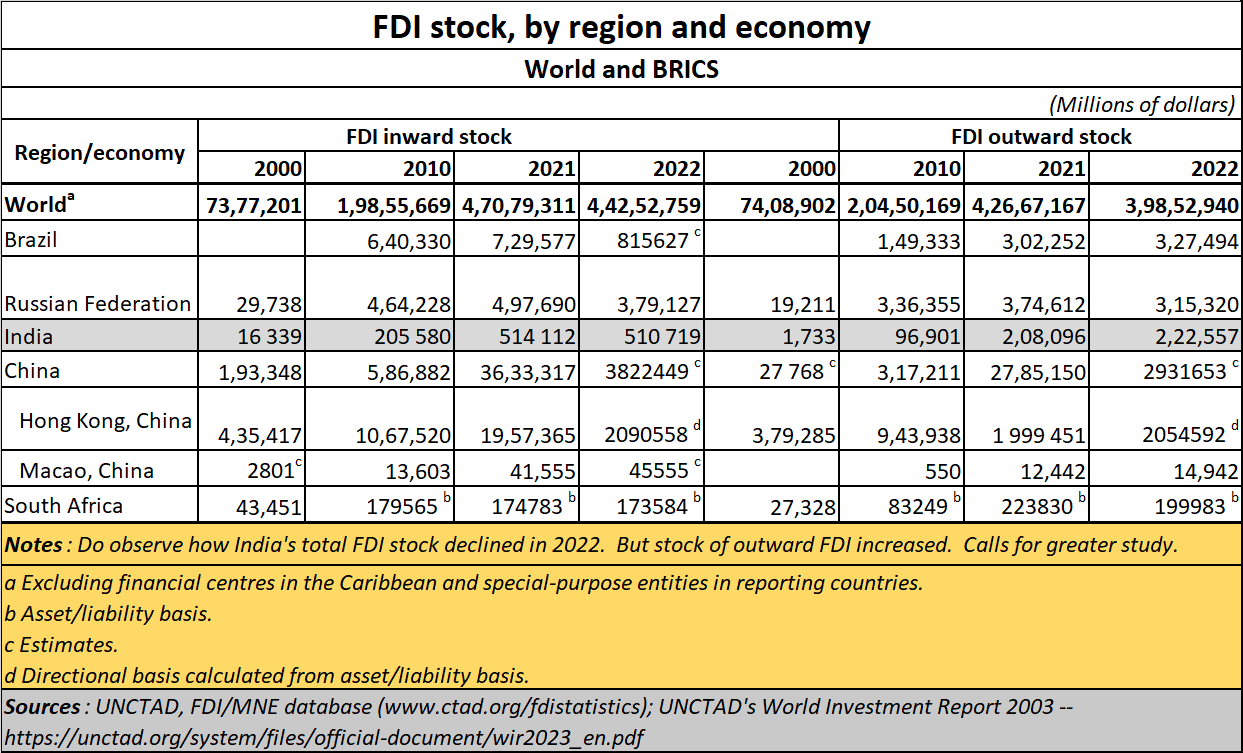
- India’s inward FDI stock increased from $16.3 billion in 2000 to $510.7 billion in 2022. That is an increase of 31 times. The shrinking of the licence raj in the 1990s was finally showing results in accelerated FDI.
- In 2000, India’s cumulative FDI stock was just 0,2% of global inward FDI.
- By 2022, India’s inward FDI stock at climbed to $510.7 billion – or 2.3% of global inward FDI.
- But outbound FDI was even more interesting. It climbed from $1.7 billion in 2000 to $222.6 billion in 2022. That was an increase of 130 times. Money travelling outside India was increasing at a more rapid pace than money coming into India.
- When this starts happening, it could be a pointer to a flight of capital. The flight of high networth individuals is quite well known now. So is the fact that many Indians are surrendering their passports to pick up citizenship in other countries (https://asiaconverge.com/2022/07/major-financial-turbulence-ahead-inr-may-weaken-further/). The 130-fold increase in outbound FDI would therefore be something that will require deeper study.
 Other select countries
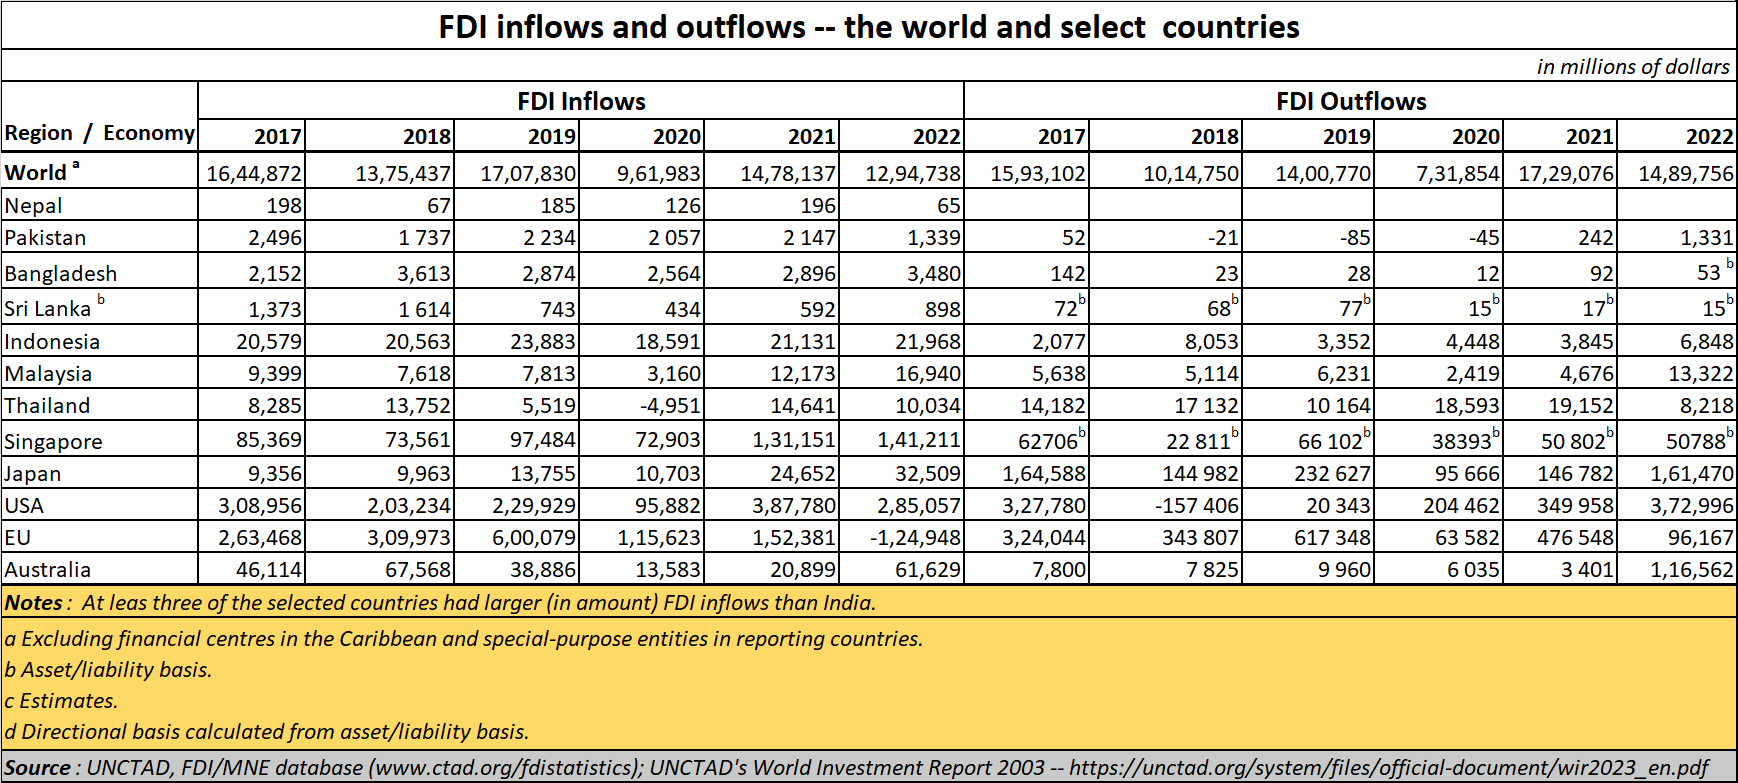
This is where it is interesting to look at numbers for some select countries. The ones chosen here are India’s closest neighbours and the most developed nations in the world.
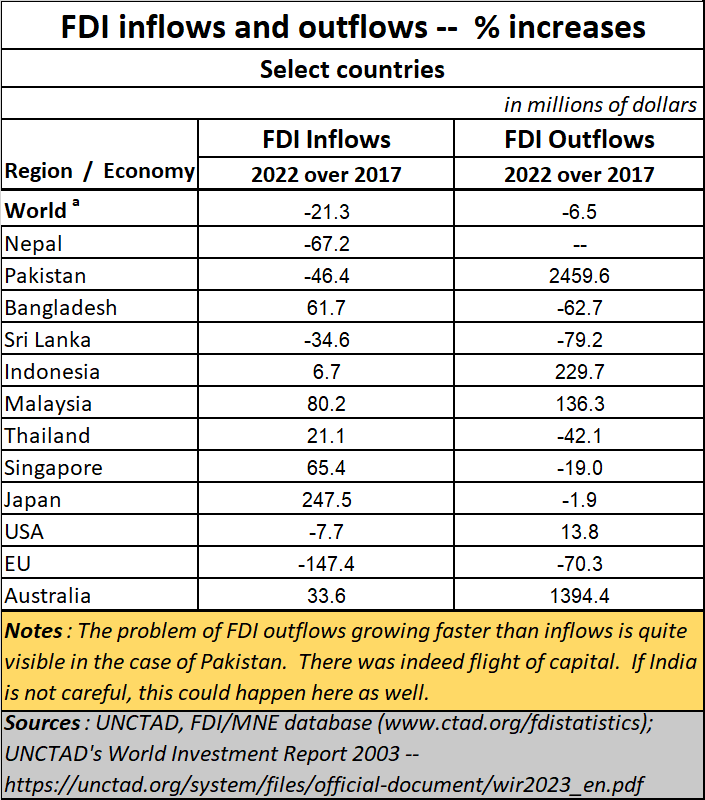
- Look at the sad story that Pakistan’s numbers tell. Inward FDI has begun to decline alarmingly. Equally alarming is the rise in outbound FDI.
- Japan saw its inward FDI climb from a share of 0.6% of global inbound FDI in 2017 to 2.5% of global FDI in 2022.
- Bangladesh saw hardly any outbound FDI.
- Contrary to perceptions that the US is not an attractive destination, that country saw its share of global inbound FDI swell from 18.8% in 2017 to 26.2%. It still has a lot of oomph!
- The EU story is sad. It enjoyed a share of 16% of global inbound FDI in 2017. In 2017, it saw its FDI decline.
- Australia, contrary to expectations, saw its share of global inbound GDI swell from 2.8% in 2017 to an impressive 4.8% in 2022.
- But watch Malaysia. Its share of global inbound FDI climbed from a share 0.6% in 2017 to 1.3%. This could become a wonder-child for this part of the world.
Finally study the numbers in the large chart. Look carefully at countries where outward FDI has climbed faster than inbound FDI. You have Pakistan, Indonesia, even Malaysia. And interestingly, you have USA as well. And do look at the numbers for Australia.
Very interesting numbers, indeed.


COMMENTS